Holding Its Footing, With Plenty Moving Underneath
| The Bottom Line: Naples closed September 2026 with 623 sales, up 2.5% from last year, while inventory fell 17.3% to 4,240 homes and months of supply dropped from 7.8 to 5.5. The median closed price rose 4.5% to $575,000, homes sold 8 days faster, and sellers received 94.8% of list price, up from 93.9%. Underneath that steady headline, the $1.5 to $5 million range tightened more than any other price point, single family and condo prices moved in opposite directions, and pending sales slipped 6.8%, the one number I'm watching most closely as season arrives. |
Key Takeaways for September 2026
- The $1.5M to $5M market kept tightening. Months of supply fell from 9.7 to 5.4 in a year, the biggest drop of any price range. Sellers here have more leverage than they've had in years.
- Prices are steady, not climbing. September's median rose 4.5% to $575,000, but the rolling 12 month median is $590,000 (down 1.7%) and the year to date median is flat at $600,000.
- Single family sellers are coming back early. New listings jumped 14.5% and sellers received 95.5% of list price, the best monthly result in a year.
- Condo pendings fell 15.8%. Condo supply is much tighter than last year, but fewer new contracts are being signed. That's the number to watch heading into season.
- The $300,000 line matters. Homes under $300,000 are the slowest to sell outside ultra luxury, while single family homes from $300,000 to $500,000 are the tightest corner of the county at 3.9 months of supply.
The Headline Numbers
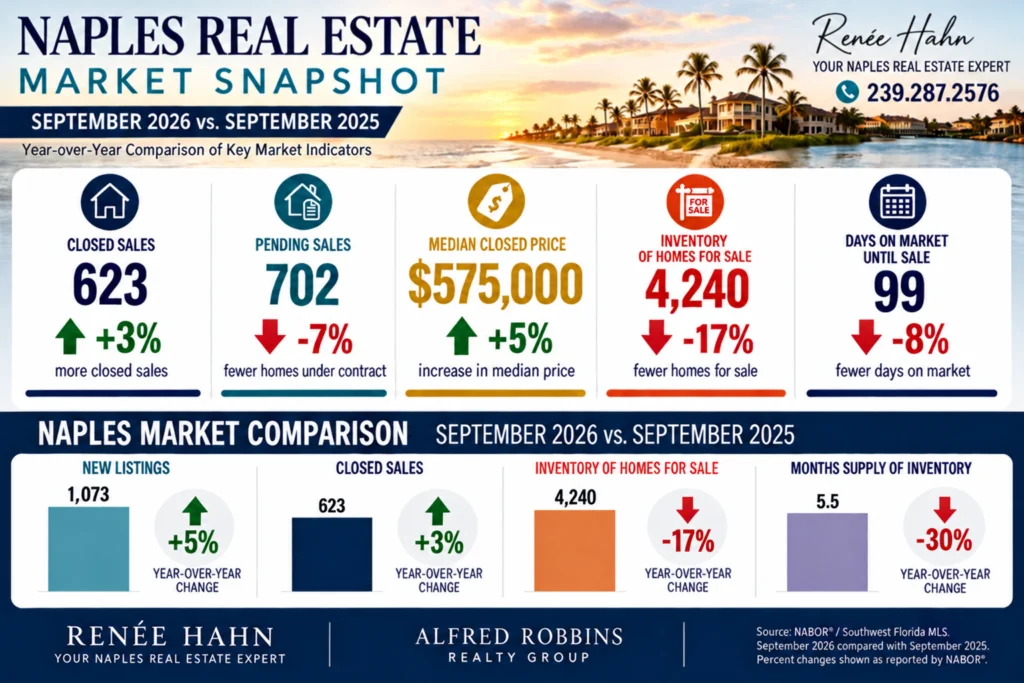
Read together, September's eight numbers describe a Naples market that has absorbed most of the excess inventory that piled up in 2025 and is now settling into balance rather than swinging toward either extreme. Sales grew a little faster than a year ago, new listings grew a little faster than sales, and inventory still dropped sharply because last year's backlog kept clearing. Homes sold faster and closer to asking price, which is what you'd expect when supply shrinks by almost a fifth. The one number pointing the other way is pending sales, down 6.8%. Pendings are contracts signed but not yet closed, so they're the closest thing in this report to a preview of October and November. Here is the overall Naples market (Collier County, excluding Marco Island), September 2026 compared to September 2025:
| Metric | Sep 2025 | Sep 2026 | YoY Change |
| Closed Sales | 608 | 623 | +2.5% |
| New Listings | 1,024 | 1,073 | +4.8% |
| Pending Sales | 753 | 702 | -6.8% |
| Inventory | 5,128 | 4,240 | -17.3% |
| Median Closed Price | $550,000 | $575,000 | +4.5% |
| Days on Market | 107 | 99 | -7.5% |
| Months of Supply | 7.8 | 5.5 | -29.5% |
| Pct. of List Price Received | 93.9% | 94.8% | +0.9 pts |
NABOR publishes this report roughly ten days after month end (this one is current as of October 10, 2026), so it reflects transactions that actually closed in September, many of them negotiated in July and August. It is a record of what happened, not a live snapshot.
Beyond the Headlines: What the Averages Are Hiding
The eight numbers above are the weather report. The real story lives in the price range, bedroom count, and property type breakdowns further back in the NABOR report, and September had some genuinely interesting ones.
The average price is up 23.8%. Please don't believe it. The overall average closed price jumped 23.8% to $1,210,050, while the median rose just 4.5% to $575,000. For single family homes the gap is even wider: the average rose 36.7% to $1,682,926, but the median rose only 3.1% to $747,500. When the average sprints and the median walks, a handful of very expensive closings are doing the pulling. Naples Beach single family homes alone averaged $6.6 million in September. The typical Naples home did not get 24% more expensive this year, and anyone quoting that number is quoting the wrong one.
September's 4.5% price gain is one month. The 12 month trend is flat. A single month's median can bounce around. NABOR's rolling 12 month median, which smooths out those bounces, tells a calmer story: $590,000 for all properties, down 1.7% from a year ago. Single family is up 1.9% to $750,000 on that rolling basis, and condos are down 3.3% to $435,000. Year to date, the overall median is exactly flat at $600,000. So the honest summary is that Naples prices are holding steady, not climbing and not falling. That matters for sellers setting expectations and for buyers waiting on a price drop that the data doesn't show coming.
The $1.5 to $5 million range went from buyer's market to balanced in twelve months. A year ago, homes priced between $1.5 and $5 million carried 9.7 months of supply. Today it's 5.4 months, a 44.3% drop and the biggest tightening of any price range. Inventory in that bracket fell 27.4% to 660 homes while trailing 12 month sales rose 33.6% to 1,309. Condos in that range tightened even more, from 11.7 to 5.5 months of supply, with sales up 41.9%. Upper luxury is now about as balanced as the $300,000 to $500,000 range (5.5 months). Pair that with sales under $300,000 also rising 33.6%, while the $500,000 to $1.5 million middle grew a more modest 9.4%, and Naples is still shaped like a barbell: the most momentum is at both ends.
Entry level is busy, but it's the hardest place to be a seller right now. Homes under $300,000 posted strong sales growth, but they're also the only price range where inventory grew, up 3.5% to 555 homes, driven by condos (up 11.9% to 470). Days on market in this bracket rose 20.2% to 113 on a rolling basis, and sellers received 92.8% of list price, lower than every other range except $5 million plus. Step just one bracket up and the picture flips: single family homes between $300,000 and $500,000 have only 3.9 months of supply and sell for 96.1% of list price, the tightest corner of the entire county. That $300,000 line matters more than it looks.
Bigger homes are pulling away from smaller ones. Homes with four or more bedrooms saw their rolling median rise 5.5% to $1,350,000 (single family four bedroom homes rose 8.0%), with sales up 25.0%. Meanwhile one bedroom medians fell 13.5% to $180,000 and two bedrooms fell 5.0% to $380,000. One bedroom homes are also the only bedroom count where months of supply went up, rising 5.4% to 9.8 months. Three bedroom homes are the scarcest, at just 4.7 months of supply. In plain terms, the premium for space is growing, and small units are where buyers have the most leverage.
Ultra luxury is slow, but sellers are giving up less at the closing table. Homes over $5 million still carry 10.1 months of supply, the loosest of any price range, and take about 152 days to go under contract. But sellers in that bracket received 92.7% of list price on a rolling basis, up 0.8 points, the biggest improvement of any price range. Luxury buyers take their time, but they aren't negotiating harder once they commit. One exception worth naming: condos over $5 million are the only property type and price combination where months of supply rose, up 10.6% to 14.6 months. That is a genuinely soft niche.
Single Family vs. Condo: Same Sales Growth, Different Directions
Single family and condo sales both rose exactly 2.5% in September. That is where the similarity ends.
Single family: firm prices, and sellers returning early. 332 closed sales, median price up 3.1% to $747,500, and 5.3 months of supply. Sellers received 95.5% of list price, the highest monthly reading in the past twelve months. New listings jumped 14.5% to 576, the most single family listings in any month since April, and single family inventory ticked up for the first time since February (2,057 in August to 2,072 in September). Pendings held up too, up 1.3% to 403. Demand is steady, and sellers are starting to come back ahead of season.
Condos: much tighter supply, softer prices, and a cooling pipeline. 291 closed sales, median price down 2.4% to $400,000, and 5.8 months of supply, down from 8.5. New listings fell 4.6% and inventory fell 17.9%, so fewer condo owners are testing the market. Days on market improved 11.3% to 102. The flag is pendings, down 15.8% to 299, the largest drop of any headline category. Keep that in context: condos had a big year, with year to date sales up 20.1% and year to date pendings up 29.8%, so some of this is a pause after a lot of absorption. My read is that condo pricing is still working through the reset that followed Florida's newer building inspection and reserve requirements, and the median has hovered right around $400,000 to $420,000 since July.
Neighborhood Spotlight: Where the Outliers Are
The countywide numbers average together some very different neighborhoods. These are the ones that stood out in September.
North Naples single family is the tightest market in the county. Single family homes in North Naples (34109, 34110, 34119) have just 3.9 months of supply, the lowest of any area in the report, with inventory down 21.0% to 339 homes. Sales actually fell 14.0% to 74, and I read that as a supply problem, not a demand problem: buyers can only buy what's listed. The median rose 2.2% to $932,500 for the month and 5.7% year to date to $1,025,000.
South Naples single family came alive, while its condos keep softening. South Naples (34112, 34113) single family sales jumped 64.0% to 41, new listings rose 44.1%, and sellers received 95.3% of list price, up from 91.8%. The monthly median fell 10.5% to $716,000, but the year to date median is up 5.3% to $735,000, so that dip looks like more mid priced homes closing rather than falling values. South Naples condos are a different story: the median fell 9.5% to $335,000 for the month and 11.6% year to date to $340,000, with 500 condos for sale. That is sustained softness, not a one month blip.
East Naples is where homes sell closest to asking. East Naples single family sellers received 96.9% of list price, the highest of any area and property type in the report, and homes went under contract in 81 days, 10.0% faster than last year. The median, $608,495, is well below the county's single family median. East Naples condos tightened sharply too, from 9.5 to 5.5 months of supply.
Naples Beach: ignore the 49% headline, watch the inventory. The single family median jumped 49.4% to $2,764,500 and the average hit $6.6 million on 44 sales. Within that, zip 34102 (Old Naples) posted a 92.5% median gain while 34103 fell 36.3%. That's what a small luxury sample looks like when a few big closings land in one zip and not the other. The year to date single family median is actually down 3.3% to $2.9 million. The more meaningful number is supply: single family inventory fell 23.5% to 367, and months of supply dropped from 11.7 to 7.3.
Immokalee/Ave Maria remains the county's buyer friendly pocket. This is the only area where single family supply grew: inventory rose 2.5% to 164 homes, months of supply climbed from 7.2 to 9.1, days on market rose 15.0% to 115, and sales fell 19.0%. At the zip level, Ave Maria inventory is up 9.3% with 118 days on market. This continues the pattern from the last few months and remains the one pocket of Collier County that clearly favors buyers.
A note on small samples: Several numbers in this report rest on very few sales: Immokalee/Ave Maria condos (3 sales), zip 34116 (17 sales, with days on market down 55.6%), and zip 34102 (23 sales). Percentage swings on samples that small can look dramatic and mean very little, so I haven't built any conclusions on them. I'm happy to pull zip or community level data for anyone looking at those areas.
What This Means for Sellers
This is a healthy market for well priced homes, and September shows exactly what well priced looks like. Single family sellers received 95.5% of list price, the best monthly result in a year, and homes sold 8 days faster than last September. But competition is about to increase. Single family new listings rose 14.5% and inventory ticked up month over month for the first time since February, which is the normal start of the season ramp. If you plan to list this winter, getting to market before the January listing wave (January brought 1,952 new listings this year) gives you more buyer attention with fewer homes to compete against.
If you own between $1.5 and $5 million, you are in a far stronger position than a year ago, at 5.4 months of supply instead of 9.7. If you own a condo, especially a one or two bedroom, price against the active competition in your building and be ready with association financials, reserve information, and inspection reports up front, because condo buyers are asking for them. And if you're under $300,000, plan for a longer runway; that bracket is averaging 113 days to contract.
What This Means for Buyers
You still have room to negotiate in Naples, just not evenly. Countywide, homes are selling for about 5% under list price. The most leverage is in condos, especially one and two bedroom units and South Naples condos; in homes under $300,000, where inventory is growing; in condos over $5 million, with 14.6 months of supply; and in Ave Maria, where supply keeps rising. The least leverage is in single family homes between $300,000 and $500,000, three bedroom homes, and North Naples single family, all under 5 months of supply. In those segments, a good home priced right will not wait for you.
Timing matters too. Pending sales dipped 6.8% in September, and NABOR's own commentary notes that higher mortgage rates than last year are making buyers more deliberate. That makes October and November a quieter window, before seasonal buyers arrive, to shop with less competition. If you're waiting for a broad price correction, the rolling 12 month median ($590,000, essentially flat) and shrinking supply don't point to one.
My Perspective
NABOR summed up September as neither runaway nor stalled, and I agree. But "balanced" at the county level hides a market that's very unbalanced in specific places. The $1.5 to $5 million range just had its best year of tightening. Small single family homes between $300,000 and $500,000 are scarce. North Naples is short on homes. At the same time, entry level condos, one bedroom units, ultra luxury condos, and Ave Maria all give buyers real negotiating power.
The number I'm watching is pendings. Closings tell you what already happened; pendings tell you what's coming. A 15.8% drop in condo pendings while single family pendings held steady tells me the next couple of months could separate those two markets even further. If I were pricing a home or writing an offer today, I wouldn't start with the county median. I'd start with the bracket, the property type, and the zip code, because that's where the real market is. That's why I break this report down the way I do every month.
Naples Market FAQ: September 2026
Is Naples, FL a buyer's or seller's market right now? Naples is close to balanced, with 5.5 months of supply in September 2026, down from 7.8 a year earlier. Single family homes between $300,000 and $500,000 lean toward sellers at 3.9 months of supply, while condos over $5 million lean strongly toward buyers at 14.6 months.
Are home prices dropping in Naples? No. The median closed price in Naples rose 4.5% to $575,000 in September 2026, and the rolling 12 month median is essentially flat at $590,000. Condo prices are softer, with a $400,000 median, down 2.4% year over year.
What is the median home price in Naples, FL? The median closed price for all Naples area homes was $575,000 in September 2026. Single family homes had a median of $747,500 and condos had a median of $400,000.
How many homes are for sale in Naples right now? There were 4,240 homes for sale in the Naples area at the end of September 2026, down 17.3% from 5,128 a year earlier: 2,072 single family homes and 2,168 condos.
How long does it take to sell a home in Naples? Naples homes averaged 99 days on market until sale in September 2026, 8 days faster than a year earlier. Single family homes averaged 97 days and condos 102 days.
How much below asking price are Naples homes selling? Naples homes sold for an average of 94.8% of list price in September 2026, roughly 5% under asking. Single family homes sold for 95.5% of list price and condos for 94.0%.
Looking Ahead
Here’s what I’ll be watching as season gets underway:
- Pending sales: September's 6.8% dip (and 15.8% for condos) should show up in October and November closings. I'll be watching whether that's a pause or a trend.
- Single family inventory: it rose month over month for the first time since February. Seasonal listings usually build through January, so how fast buyers absorb them will set the tone for winter pricing.
- The $1.5 to $5 million range: at 5.4 months of supply, it's worth watching whether price gains follow the tighter supply.
- Condo prices: the median has hovered between $399,500 and $420,000 since July. A move below that range would signal more softening.
- Ave Maria: supply has been rising for several months; a turn here would be an early sign the eastern communities are firming up.
- Mortgage rates: NABOR noted they're higher than last September, and rate moves will shape how quickly seasonal buyers commit.
Past Monthly Market Updates
- September 2026
- August 2026
- July 2026
- June 2026
- May 2026
- April 2026
Source: Naples Area Board of REALTORS (NABOR) September 2026 Market Report. Data reflects Collier County, excluding Marco Island.
Want every chart and table? Download the full NABOR September 2026 Market Report (PDF)
Renee Hahn
Consistently ranked in the top 0.5% to 1.5% in the Nation
Naples, Florida | (239) 287-2576 | Renee@YourNaplesExpert.com | www.YourNaplesExpert.com